
Technical data


8
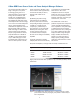
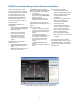
Figure 10 The Power Panel shows a multi-list measurement view of power
data in the top table, and ratio and difference computation results
between two or more channels in the bottom table.
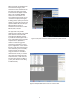
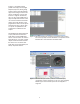
Figure 11 The Power Analyzer shows a powerful customizable display
confi guration of various data inputs. In this case, four completely
different types of measurement processes are displayed in a
single tab.
In Figure 11, the Power Analyzer
provides four display formats; Digital
Softpanel, Strip Chart, Analog Gauge
and Trace Graph. The Power Analyzer
supports and manages more than ten
sensors and displays up to four data
results in a single tab. Furthermore,
users can also create multiple tabs to
support multiple measurements. Users
can save and restore their instrument
settings. The Power Analyzer can be
programmed in order to record specifi c
measurements using a specifi c setup
at a specifi c or repetitive time. The
archived data is available for later
analysis.
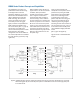
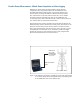
The N1918A Power Analysis Manager
accepts power data from both the
power meters and the U2000 Series
sensors at the same time. As shown in
Figure 20 later on, it can then compute
complex statistical data like CCDF. At
the same time it can monitor other
power data using a digital display and
overlay comparison routines.