
User`s guide


9CCDF
218 N1911A/1912A P-Series Power Meters User’s Guide
Introduction
Many of the present digitally modulated signals now look noise- like in the
time and frequency domains. This means that statistical measurements of
the signals can be a useful characterization. Power Complementary
Cumulative Distribution Function (CCDF) curves characterize the higher
level power statistics of a digitally modulated signal. The curves can be
useful in determining design parameters for digital communication
systems.
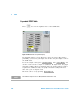
A CCDF curve is defined by how much time the waveform spends at or
above a given power level. This is expressed in dB relative to the average
power. A CCDF curve is a plot of relative power levels versus probability
where the X- axis represents the dB above the average signal power, while
the Y- axis represents the percent of time the signal spends at or above the
power level specified by the X- axis.
The most important application of power CCDF curves is to specify,
completely and without ambiguity, the power characteristics of the signals
that will be mixed, amplified, and decoded in communication systems. For
example, baseband DSP signal designers can completely specify the power
characteristics of signals to the RF designers by using CCDF curves. This
helps avoid costly errors at system integration time. Similarly, system
manufacturers can avoid ambiguity by completely specifying the test signal
parameters to their amplifier suppliers.
CCDF curves apply to many design applications. Some of these
applications are:
• Visualizing the effects of modulation formats.
• Combining multiple signals via system’s components (for example,
amplifiers).
• Evaluating spread- spectrum systems.
• Designing and testing RF components.