
User`s guide


7-31
Operating Concepts
Analyzer Display Formats
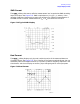
Figure 7-15 Higher Order Phase Shift
The analyzer computes group delay from the phase slope. Phase data is used to find the
phase change, ∆ Φ over a specified frequency aperture, ∆ f, to obtain an approximation for
the rate of change of phase with frequency. Refer to Figure 7-16. This value, (τ)
g
,
represents the group delay in seconds assuming linear phase change over ∆f. It is
important that ∆Φbe ≤ 180°, or errors will result in the group delay data. These errors can
be significant for long delay devices. You can verify that ∆ Φ is ≤ 180° by increasing the
number of points or narrowing the frequency span (or both) until the group delay data no
longer changes.
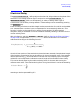
Figure 7-16 Rate of Phase Change Versus Frequency
When deviations from linear phase are present, changing the frequency step can result in
different values for group delay. Note that in this case the computed slope varies as the
aperture ∆f is increased. See Figure 7-17. A wider aperture results in loss of the fine grain
variations in group delay. This loss of detail is the reason that in any comparison of group
delay data, it is important to know the aperture that was used to make the measurement.