
Operating instructions


University of Saskatchewan
Electrical Engineering Laboratory Equipment Manual
Printing the Display
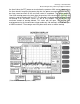
The HP 3580A is an analog spectrum analyzer and cannot directly print to the
printers available in the laboratories. However, you can hook the analyzer up to an
Oscilloscope, and print the spectra from there.
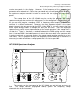
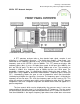
On the back of the analyzer are a number of connectors. The ones marked
RECORDER X-AXIS and Y-AXIS are the ones you will need. These outputs are meant
for printing to an old-fashioned pen plotter.
The oscilloscope should have its two X and Y input channels (channels 1 and 2
respectively) set to dc coupling, and 500mV/div. Position each channel’s ground level
to approximately the middle of the screen. The X-AXIS output on the analyzer goes to
the X channel on the scope, and similarly the Y-AXIS output gets connected to the Y
channel. Once you have made the necessary connections, turn on the X vs. Y display
mode of the oscilloscope.
You should see a dot moving across the Scope screen. Set the Analyzer’s
Sweep Mode knob to MAN for manual. Use the Sweep Mode vernier knob to adjust the
dot on the analyzer’s display to the center vertical graticule. Use the Scope X channel
position knob to move the dot left or right, and use the Scope Y channel position knob to
move it up or down. Your goal is to place the dot on the center vertical graticule of the
scope display to resemble the dot on the analyzer’s display. Once this is done, set the
Sweep Mode knob to SING for single sweep.
Once this has been accomplished, press the Auto-store button (HP Scopes) or
set the display persistence to infinite (some of the other scopes). Press and release the
Display Clear Write button, on the Analyzer, to activate a single display sweep. Once
the spectrum analyzer’s screen has been traced by the scope, press the Scope’s stop
button and print the waveform.
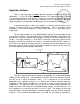
Amplitude Response of Two-Port Networks
There is an output on the back of the spectrum analyzer called the TRACKING
OSC (oscillator) OUT, along with a LEVEL adjust knob. The output is a sine wave with
a variable swept frequency that is synchronized to, or tracks the frequency being
analyzed across the screen at any point in time. This is used to make a measurement of
the frequency response of a two-port network (i.e. a filter, an amplifier, etc.). The output
impedance of the TRACKING OSC OUT is 600 and not the standard 50 found in all
signal generators. For this reason, a buffer amplifier (a voltage follower) should be
employed to isolate the tracking oscillator from the network you are testing to avoid
circuit loading. Connect the TRACKING OSC OUT through a voltage follower to the
input of the spectrum analyzer. The TRACKING OSC LEVEL knob is adjusted for a
reference level of aprox. - 40 dBv on the front display. All measurements are referenced
from this level. Connect the output of the voltage follower to the input of your network.