
User`s guide

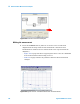

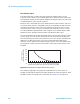
Table Of Contents
- Title Page
- Contents
- Getting Started
- Introduction and Measurement
- Phase Noise Basics
- Expanding Your Measurement Experience
- Starting the Measurement Software
- Using the Asset Manager
- Using the Server Hardware Connections to Specify the Source
- Setting GPIB Addresses
- Testing the 8663A Internal/External 10 MHz
- Testing the 8644B Internal/External 10 MHz
- Viewing Markers
- Omitting Spurs
- Displaying the Parameter Summary
- Exporting Measurement Results
- Absolute Measurement Fundamentals
- Absolute Measurement Examples
- Residual Measurement Fundamentals
- What is Residual Noise?
- Assumptions about Residual Phase Noise Measurements
- Calibrating the Measurement
- Measurement Difficulties
- Residual Measurement Examples
- FM Discriminator Fundamentals
- FM Discriminator Measurement Examples
- AM Noise Measurement Fundamentals
- AM Noise Measurement Examples
- Baseband Noise Measurement Examples
- Evaluating Your Measurement Results
- Advanced Software Features
- Reference Graphs and Tables
- Approximate System Noise Floor vs. R Port Signal Level
- Phase Noise Floor and Region of Validity
- Phase Noise Level of Various Agilent Sources
- Increase in Measured Noise as Ref Source Approaches DUT Noise
- Approximate Sensitivity of Delay Line Discriminator
- AM Calibration
- Voltage Controlled Source Tuning Requirements
- Tune Range of VCO for Center Voltage
- Peak Tuning Range Required by Noise Level
- Phase Lock Loop Bandwidth vs. Peak Tuning Range
- Noise Floor Limits Due to Peak Tuning Range
- Tuning Characteristics of Various VCO Source Options
- 8643A Frequency Limits
- 8644B Frequency Limits
- 8664A Frequency Limits
- 8665A Frequency Limits
- 8665B Frequency Limits
- System Specifications
- System Interconnections
- PC Components Installation
- Overview
- Step 1: Uninstall the current version of Agilent Technologies IO libraries
- Step 2: Uninstall all National Instruments products.
- Step 3: Install the National Instruments VXI software.
- Step 4: Install the National Instruments VISA runtime.
- Step 5: Install software for the NI Data Acquisition Software.
- Step 6: Hardware Installation
- Step 7. Finalize National Instruments Software Installation.
- Step 8: System Interconnections
- Step 9: Install Microsoft Visual C++ 2008 Redistributable Package use default settings
- Step 10: Install the Agilent I/O Libraries
- Step 11: Install the E5500 Phase Noise Measurement software.
- Step 12: Asset Configuration
- Step 13: License Key for the Phase Noise Test Set
- Overview
- PC Digitizer Performance Verification
- Preventive Maintenance
- Service, Support, and Safety Information
- Safety and Regulatory Information
- Safety summary
- Equipment Installation
- Environmental conditions
- Before applying power
- Ground the instrument or system
- Fuses and Circuit Breakers
- Maintenance
- Safety symbols and instrument markings
- Regulatory Compliance
- Declaration of Conformity
- Compliance with German noise requirements
- Compliance with Canadian EMC requirements
- Service and Support
- Return Procedure
- Safety and Regulatory Information
Evaluating Your Measurement Results
14
Agilent E5505A User’s Guide 327
Comparing against expected data
If none of the problems listed appears on your graph, there still may be
problems or uncertainties that are not obvious at first glance. These
uncertainties can be evaluated by comparing your measurement results
against the following data:
• The noise characteristics expected for your DUT.
• The noise floor and accuracy specifications of the phase noise test system.
• The noise characteristics of the signal source used as the reference source.
The device under test
If you are testing a product for which published specifications exist, compare
the measurement results against the noise and spur characteristics specified
for the product. If the product is operating correctly, the noise graph provided
by the phase noise system should be within the noise limits specified for the
product.
If the device is a prototype or breadboard circuit, it may be possible to
estimate its general noise characteristics using the characteristics of a similar
type of circuit operating in a similar manner.
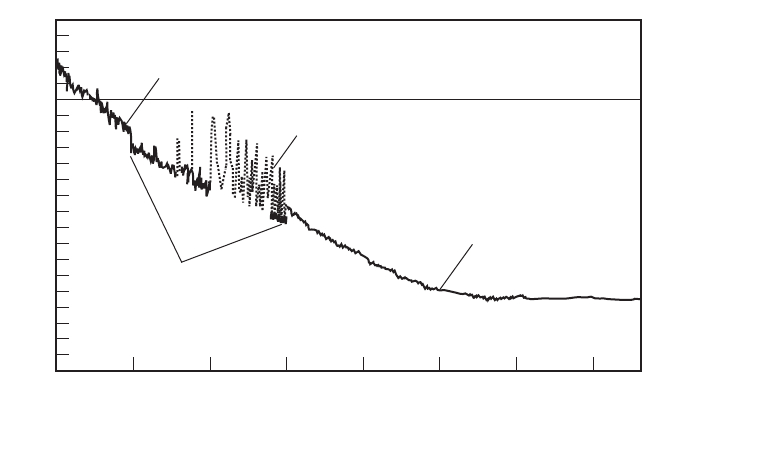
Figure 260 Noise plot showing obvious problems
10M 40M1001011M100K10K1K
0
20
40
-20
-40
-60
-80
-100
-120
-140
-160
E5505a_noise_curve_problems
02 Mar 04 rev 1
L( f ) = -[dBc/Hz] vs. f [Hz]
High small
angle noise
Spurs
Breaks
High noise
level