
User`s guide

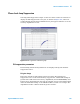
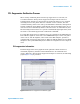
Table Of Contents
- Title Page
- Contents
- Getting Started
- Introduction and Measurement
- Phase Noise Basics
- Expanding Your Measurement Experience
- Starting the Measurement Software
- Using the Asset Manager
- Using the Server Hardware Connections to Specify the Source
- Setting GPIB Addresses
- Testing the 8663A Internal/External 10 MHz
- Testing the 8644B Internal/External 10 MHz
- Viewing Markers
- Omitting Spurs
- Displaying the Parameter Summary
- Exporting Measurement Results
- Absolute Measurement Fundamentals
- Absolute Measurement Examples
- Residual Measurement Fundamentals
- What is Residual Noise?
- Assumptions about Residual Phase Noise Measurements
- Calibrating the Measurement
- Measurement Difficulties
- Residual Measurement Examples
- FM Discriminator Fundamentals
- FM Discriminator Measurement Examples
- AM Noise Measurement Fundamentals
- AM Noise Measurement Examples
- Baseband Noise Measurement Examples
- Evaluating Your Measurement Results
- Advanced Software Features
- Reference Graphs and Tables
- Approximate System Noise Floor vs. R Port Signal Level
- Phase Noise Floor and Region of Validity
- Phase Noise Level of Various Agilent Sources
- Increase in Measured Noise as Ref Source Approaches DUT Noise
- Approximate Sensitivity of Delay Line Discriminator
- AM Calibration
- Voltage Controlled Source Tuning Requirements
- Tune Range of VCO for Center Voltage
- Peak Tuning Range Required by Noise Level
- Phase Lock Loop Bandwidth vs. Peak Tuning Range
- Noise Floor Limits Due to Peak Tuning Range
- Tuning Characteristics of Various VCO Source Options
- 8643A Frequency Limits
- 8644B Frequency Limits
- 8664A Frequency Limits
- 8665A Frequency Limits
- 8665B Frequency Limits
- System Specifications
- System Interconnections
- PC Components Installation
- Overview
- Step 1: Uninstall the current version of Agilent Technologies IO libraries
- Step 2: Uninstall all National Instruments products.
- Step 3: Install the National Instruments VXI software.
- Step 4: Install the National Instruments VISA runtime.
- Step 5: Install software for the NI Data Acquisition Software.
- Step 6: Hardware Installation
- Step 7. Finalize National Instruments Software Installation.
- Step 8: System Interconnections
- Step 9: Install Microsoft Visual C++ 2008 Redistributable Package use default settings
- Step 10: Install the Agilent I/O Libraries
- Step 11: Install the E5500 Phase Noise Measurement software.
- Step 12: Asset Configuration
- Step 13: License Key for the Phase Noise Test Set
- Overview
- PC Digitizer Performance Verification
- Preventive Maintenance
- Service, Support, and Safety Information
- Safety and Regulatory Information
- Safety summary
- Equipment Installation
- Environmental conditions
- Before applying power
- Ground the instrument or system
- Fuses and Circuit Breakers
- Maintenance
- Safety symbols and instrument markings
- Regulatory Compliance
- Declaration of Conformity
- Compliance with German noise requirements
- Compliance with Canadian EMC requirements
- Service and Support
- Return Procedure
- Safety and Regulatory Information
Advanced Software Features
15
Agilent E5505A User’s Guide 345
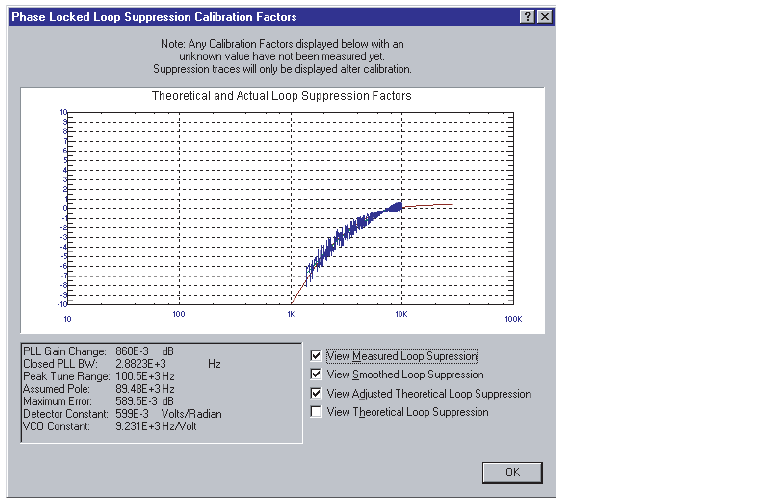
Phase-Lock-Loop Suppression
Selecting “PLL Suppression Graph” on the View menu causes the software to
display the PLL Suppression Curve plot, as shown in Figure 272, when it is
verified during measurement calibration. The plot appears whether or not an
accuracy degradation occurs.
PLL suppression parameters
The following measurement parameters are displayed along with the PLL
Suppression Curve.
PLL gain change
This is the amount of gain change required to fit the Theoretical Loop
Suppression curve to the measured loop suppression. A PLL Gain Change of
greater than 1 dB creates an accuracy degradation (ACCY. DEGRADED) error.
If an accuracy degradation is detected, the amount of error is determined from
either the PLL Gain Change or the Maximum Error, which ever is larger. The
degradation itself is 1 dB less than the greater of these.
Figure 272 PLL suppression verification graph