
User`s guide
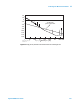

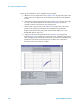
Table Of Contents
- Title Page
- Contents
- Getting Started
- Introduction and Measurement
- Phase Noise Basics
- Expanding Your Measurement Experience
- Starting the Measurement Software
- Using the Asset Manager
- Using the Server Hardware Connections to Specify the Source
- Setting GPIB Addresses
- Testing the 8663A Internal/External 10 MHz
- Testing the 8644B Internal/External 10 MHz
- Viewing Markers
- Omitting Spurs
- Displaying the Parameter Summary
- Exporting Measurement Results
- Absolute Measurement Fundamentals
- Absolute Measurement Examples
- Residual Measurement Fundamentals
- What is Residual Noise?
- Assumptions about Residual Phase Noise Measurements
- Calibrating the Measurement
- Measurement Difficulties
- Residual Measurement Examples
- FM Discriminator Fundamentals
- FM Discriminator Measurement Examples
- AM Noise Measurement Fundamentals
- AM Noise Measurement Examples
- Baseband Noise Measurement Examples
- Evaluating Your Measurement Results
- Advanced Software Features
- Reference Graphs and Tables
- Approximate System Noise Floor vs. R Port Signal Level
- Phase Noise Floor and Region of Validity
- Phase Noise Level of Various Agilent Sources
- Increase in Measured Noise as Ref Source Approaches DUT Noise
- Approximate Sensitivity of Delay Line Discriminator
- AM Calibration
- Voltage Controlled Source Tuning Requirements
- Tune Range of VCO for Center Voltage
- Peak Tuning Range Required by Noise Level
- Phase Lock Loop Bandwidth vs. Peak Tuning Range
- Noise Floor Limits Due to Peak Tuning Range
- Tuning Characteristics of Various VCO Source Options
- 8643A Frequency Limits
- 8644B Frequency Limits
- 8664A Frequency Limits
- 8665A Frequency Limits
- 8665B Frequency Limits
- System Specifications
- System Interconnections
- PC Components Installation
- Overview
- Step 1: Uninstall the current version of Agilent Technologies IO libraries
- Step 2: Uninstall all National Instruments products.
- Step 3: Install the National Instruments VXI software.
- Step 4: Install the National Instruments VISA runtime.
- Step 5: Install software for the NI Data Acquisition Software.
- Step 6: Hardware Installation
- Step 7. Finalize National Instruments Software Installation.
- Step 8: System Interconnections
- Step 9: Install Microsoft Visual C++ 2008 Redistributable Package use default settings
- Step 10: Install the Agilent I/O Libraries
- Step 11: Install the E5500 Phase Noise Measurement software.
- Step 12: Asset Configuration
- Step 13: License Key for the Phase Noise Test Set
- Overview
- PC Digitizer Performance Verification
- Preventive Maintenance
- Service, Support, and Safety Information
- Safety and Regulatory Information
- Safety summary
- Equipment Installation
- Environmental conditions
- Before applying power
- Ground the instrument or system
- Fuses and Circuit Breakers
- Maintenance
- Safety symbols and instrument markings
- Regulatory Compliance
- Declaration of Conformity
- Compliance with German noise requirements
- Compliance with Canadian EMC requirements
- Service and Support
- Return Procedure
- Safety and Regulatory Information
346 Agilent E5505A User’s Guide
15
Advanced Software Features
Max error
This is the measured error that still exists between the measured Loop
Suppression and the Adjusted Theoretical Loop Suppression. The four points
on the Loop Suppression graph marked with arrows (ranging from the peak
down to approximately ––8 dB) are the points over which the Maximum Error
is determined. An error of greater than 1 dB results in an accuracy
degradation.
Closed PLL bandwidth
This is the predicted Phase Lock Loop Bandwidth for the measurement. The
predicted PLL BW is based on the predicted PTR. The Closed PLL BW will not
be adjusted as a result of an accuracy degradation. If an accuracy degradation
is detected, the amount of error is determined from either the PLL Gain
Change or the Maximum Error, which ever is larger. The degradation itself is
1 dB less than the greater of these.
Peak tune range
This is the Peak Tuning Range (PTR) for the measurement determined from
the VCO Tune Constant and the Tune Range of VCO. This is the key parameter
in determining the PLL properties, the Drift Tracking Range, and the ability to
phase lock sources with high close in noise.
The PTR displayed should be approximately equal to the product of the VCO
Tune Constant times the Tune Range of VCO. This is not the case when a
significant accuracy degradation is detected (4 dB) by the Loop Suppression
Verification. In this case, the PTR and Assumed Pole are adjusted when fitting
the Theoretical Loop Suppression to the smoothed measured Loop
Suppression, and the test system will display the adjusted PTR. If the PTR
must be adjusted by more than 1 dB, as indicated by an accuracy degradation
of greater than 0 dB, the Phase Detector Constant or the VCO Tune Constant is
in error at frequency offsets near the PLL BW, or the PLL BW is being affected
by some other problem such as injection locking.
Assumed pole
This is the frequency of the Assumed Pole required to adjust the Theoretical
Loop suppression to match the smoothed measured Loop suppression. The
Assumed Pole frequency is normally much greater than the Closed PLL BW.
An Assumed Pole frequency of less than 10 X PLL BW is an indication of
peaking on the PLL Suppression curve. For PLL BWs less than 20 kHz, an
Assumed Pole of less than 10 X PLL BW indicates a delay or phase shift in the
VCO Tune Port. For PLL BWs greater than 20 kHz, the Assumed Pole may be
adjusted to less than 10 X PLL BW to account for phase shifts in the test set.