
Specifications
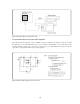
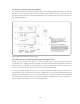
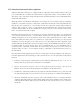
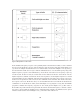
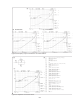
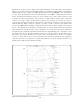

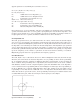


Figure 5-49. Equivalent circuit models
If the simulated frequency response curve partially fits the measurement results, it can be said that
the selected circuit mode is proper only for that part of the frequency range that it fits. Figure 5-50
(a) shows an example measurement for a low value inductor. As shown in Figures 5-50 (b) and (c),
the measurement result does not agree with the simulated curves over the full frequency range. The
higher frequency region is well simulated by circuit mode A and the lower frequency region by
circuit mode B. In other words, the circuit mode for the inductor is like the circuit mode A at the
higher frequencies and like circuit mode B at lower frequencies. At the higher frequencies C and R
in parallel with L are the dominant elements and circuit mode A describes the response curve best.
At the lower frequencies L and series R are the dominant circuit elements and circuit B describes
the response curve best. From these facts, we can determine that the real circuit mode should be the
combination of circuit modes A and B, and is like Figure 5-51 (a). Figure 5-51 (b) lists an I-BASIC
program to simulate the frequency response for the circuit given in Figure 5-51 (a). The value of
Rs should be keyed in from the front panel and entered into the internal register, so that the calcula-
tion can be executed and the simulated curve obtained. In this example, the simulated curve agreed
with the actual result as shown in Figure 5-51 (c) when the value of Rs is 1 Ω.
5-39