
User`s guide


hp
PEF
GTPOS
LOG
10
dB/
VA
VB
WC
FC
CORP
I
I
/
CENTER 50 000
MHr
SPAN 500 0
MHz
#RES
BW 100
kH2
#VBW 300
hHr
#SWP
1 0
set
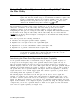
Figure 4-19. Viewing Time-Sharing of a Frequency with a Spectrum Analyzer
Trace display of the first signal, with the time gate on.
Using the Time-Gated Spectrum Analyzer Capability to View Pulsed RF
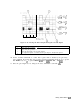
This example demonstrates how to use Option 105 to view two different pulsed RF signals. The
signals are at the same frequency, but they interleave in time. (This example uses the time gate
function without using the gate utility.)
To use Option 105 to view the amplitude of a pulsed RF signal accurately, the spectrum
analyzer settings of the sweep time, resolution bandwidth, video bandwidth, gate delay, and
gate length must be set correctly. To set the spectrum analyzer settings correctly, you must
determine the pulse repetition interval, pulse width, and signal delay (if any) of the pulsed RF
signal. Figure 4-20 shows an example of two pulsed RF signals.
4-24 Making Measurements