
User`s guide

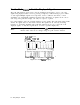


Example: Use the marker table to measure the calibrator signal.
1.
2.
3.
4.
5.
6.
Connect the CAL OUT signal to the spectrum analyzer INPUT
5OQ.
Press
C-1,
[FREQUENCY),
STOP
FREQ
, 2
GHz.
Press
(PEAK
SEARCH)
and NEXT PK RIGHT to place the marker 1 on the 300 MHz cal signal.
Press
[MKRFCTN),
MK TABLE ON OFF (ON) to turn on the marker table function.
Press
INIKR)
SELECT 1 2 3 4 (2) to select marker 2. Press MARKER ON OFF (ON) to activate
marker 2. Use the NEXT PK RIGHT key, or move the marker using the key pad or knob to
place marker 2 on the next harmonic. Repeat the process for markers 3 and 4.
Make marker 2 readout time, rather than frequency, by pressing
IIVIKR)
and pressing
SELECT 1 2 3 4 until 2 is selected (underlined). Press More 1 of 2 , MK READ F T I P
(T) to select time for the marker readout.
The marker table can be set to display the marker amplitudes relative to the display line.
Press
[MKRJ,
More 1 of 2, and TABLE ADL NRM key to underline the ADL. This
accesses the delta display line format. The display line can be moved using the knob. The
delta display line format is only available when using the marker table function.
Note
The marker table data can be printed by pressing the
m
key.
The marker table cannot be saved or recalled.
Using Analyzer Features 5-3