
User`s guide


4
PEF
.O
dBm
ATTEI‘I
IO
dB
PEAK
LOG
I
1
50
00
MHz
12 0
dB
2 250 0 MHz 10 0
dB
300.0
MHz
WA
VB
4 350 0
MHz
SC FC
CENTER 300 0 MHz
SPAN
500
0 MHz
RES BW 3.0
MHz
VBW
1
MHz
SWP
20
msec
pu149a
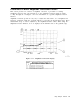
Figure 5-12. Completed Amplitude-Correction
‘Ihble
9.
Press EDIT DONE when all the points have been entered.
Use steps 10 and 11 to display corrected versus uncorrected amplitude trace data for trace
comparison.
10. Display the amplitude-corrected trace in trace A by pressing the following keys:
~~~
CLEAR WRITE A
VIEW A
11. Display the uncorrected amplitude trace in trace B by pressing the following keys:
TRACE A B C until B is selected
CLEAR WRITE B
ICAL),
More 1 of 4, More 2 of 4, More 3 of 4, Amp Cor
AMP COR ON OFF until OFF is selected
Using Analyzer Features
5.37