
Troubleshooting guide


Lab Exercise: Qualitative Data Analysis
Graphics - Signal Options
32
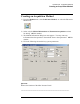
11) A panel with 3 tabs will appear. The Signals tab should be highlighted and all
signals will be initially selected. Click off one of the signals.
12) Select the Inst. Curves tab. Click to make sure there is a check in the High
Pressure checkbox. Click the General Info tab to see what information is
available.
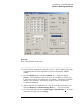
13) Click the right mouse button in the row containing the datafile. Choose Load
Selected Signals. The overlaid chromatograms and high-pressure plot will
appear.
14) An additional tool bar, the Graphics Tool Bar, can be displayed along the right
side of the chromatogram. This tool bar is turned on or off by clicking on the
Graphics Tool Do this now.
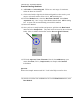
15) Now try to plot the signals separated, each in full scale. This time, you can
use the Overlay Separate Signals tool and the Each in Same Scale Tool.
You may need to scroll down to view all signals and the pressure plot.
16) Practice using the other tools in the Graphics Tool bar. You can see what the
names of the various tools are by positioning the cursor over that tool and
looking at the information line at the bottom of the Data Analysis Screen.