
Troubleshooting guide

Lab Exercise: Qualitative Data Analysis
Graphics - Annotation
33
Graphics - Annotation
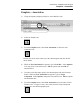
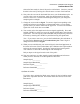
1) Using the Signal(s) Displayed drop box, select DAD1A only.
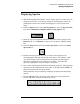
2) Select the Graphics too.
3) From the Graphics menu, select New Annotation or select the Add
Annotation tool.
Position the cursor in the center-top of the chromatogram and click the left
mouse button.
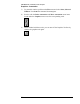
4) When the Text Annotation box appears, type in Test Mix. Select Options.
You may select a font and font size. OK the options and then OK the
annotation box.
5) Click above the third major peak in the chromatogram with the left mouse
button. When the Text Annotation box appears, type in Target
Compound. Under Options, change the text rotation to 90. OK the options
and annotation box.
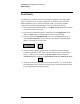
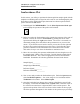
6) From the Graphics menu, select Line Annotation or use the Draw Line in
Window Tool. Using the cursor, draw a line from the Target Compound
annotation to the chromatographic peak.