
Troubleshooting guide

Lab Exercise: Qualitative Data Analysis
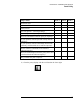
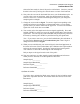
Peak Purity
37
Major Peaks Peak 1 Peak 2 Peak 3
Retention Time
Calculated Threshold
Purity Factor
Spectral Options – Wavelength Range
Spectral Options – Spectra per Peak: Threshold
Does the ChemStation indicate purity or impurity?
In your opinion, does the spectral overlay indicate
impurity?
In your opinion, does the relationship between the
similarity and threshold curves indicate impurity?
Do the number of diamonds in the red band
indicate impurity?
Does the relationship between the purity factor and
calculated threshold indicate impurity?
Do you think this peak is impure?
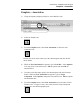
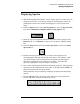
6) Close the purity display with the tool found at the lower right.