
Technical data


Module 5
Basic Measurement
5-17
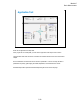
Graph Plot
Analysis tools
Auto Scale
List Display
Parameters
Data Display Window – Graph
This window displays measurement result graph, list, and parameter values.
Markers are used to traverse the actual measurement data. Markers cannot be placed anywhere on
the screen except on an actual measurement trace. They are denoted with a small circle. One moves
the markers with the front panel rotary pulse generator (RPG) knob, mouse, or touch screen.
Cursor may be used anywhere on the screen and are denoted by a small cross. The cursor is moved
using mouse, touch screen, or an arrow key.
The line function may be selected to draw one of four types of lines: line between cursors, gradient
line, tangent line, regression line.
One of the most used interactive functions on this window is the autoscale feature which is applied
by clicking the icon of yardsticks.