
User`s guide

340
Logic Analyzer Reference
The Chart Menu
The Chart Menu
State Chart is a software post-processing feature that provides the
ability to build x-y charts of label activity using state data. The Chart
menu builds a graphical representation of the system under test. The Y
axis always represents data values for a specified label. You can select
whether the X axis represents states (rows in the state listing) or the
data values for another label.
When the X-axis is set to State, X and O markers are available which
display the current sample relative to the trace point and the
corresponding Y-axis data value. Marker placement is synchronized
with the normal state listing.
An accumulate mode is available that allows the chart display to build
up over several runs.
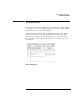
You can generate x-y charts of Label vs. Label or Label vs. State.
Label vs. Label charts
When labels are assigned to both axes, the chart shows how the data
acquired under one label varies relative to the other for a particular
measurement. Label values are always plotted in ascending order from
the bottom to the top of the chart and in ascending order from left to
right across the chart. Plotting a label against itself will result in a
diagonal line from the lower left to upper right corner. All markers are
disabled when plotting this kind of chart.
Label vs. State charts
Label versus State is a plot of data values acquired under a label versus
the memory location of the same data. The label value is plotted
against successive memory location numbers.