
User`s guide

360
System Performance Analysis (SPA) Software
System Performance Analysis Software
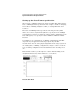
Data sampling and sorting. When Run is pressed, all input channels
defined in the Format Specification are sampled. Once acquired, the
sampled data is sorted into the buckets of the specified label, and the
State Overview display is updated. The acquisition is repeated until
Stop is pressed or until a display variable is changed.
Y axis scaling. The display builds a vertical histogram where the Y
axis represents the relative number of occurrences in each of the
buckets. As successive acquisitions are acquired and sorted, the
display is constantly re-scaled vertically so that the upper limit of the Y
axis represents the largest number of occurrences in any bucket.
The Y axis maximum limit is displayed in Max count.
Total count. The Total count field is the total number of states
sampled over the entire label range since the measurement was
started.
X and O markers. Markers can be placed on any bucket to determine
the number of occurrences in that bucket. The X Mark count and O
Mark count fields display the number of occurrences at the markers.
The markers move only on the bucket boundaries.
The range of each bucket can be determined by selecting the Xmarker
or Omarker fields and noting the change in the marker value in the
pop-up as the marker is moved slowly across the display.