
User`s guide

363
System Performance Analysis (SPA) Software
System Performance Analysis Software
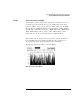
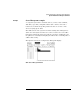
State Overview mode does not display data that falls out of the range of
its Low and High values. State Histogram, on the other hand, has an
"Other States included/excluded" feature that will present a histogram
of any activity that does not fall into the defined ranges (see "Other
States included/ excluded," later in this section).
State Overview samples and displays all activity on the specified label.
But State Histogram allows data qualification so that only activity of
interest is sampled and displayed (see "Trace Type: All States vs.
Qualified States," later in this section).
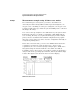
Range specifiers. A maximum of 11 ranges are available. The ranges
are defined by specifying a low and high value on the specified label
and by a name you define. The ranges need not be contiguous. If two
ranges overlap in any manner, acquired data will be counted in both
ranges.
If a range has a low and high value and a name defined, and the range is
turned off, it will retain the low and high value and name when turned
back on.
User-defined ranges vs. symbols. When defining low and high
values for the State Histogram ranges, you may use symbols instead of
entering discrete values. Symbols can only be used for labels selected
in the State Histogram mode if they are defined in the Format
Specification, and only if the base in the State Histogram menu is set to
Symbol.
Pattern or range symbols defined in the Format Specification can be
used to set the low or high value of a range.
Total samples. The Total samples field displays the total number of
samples in all the displayed ranges. If Other States included is selected,
then total samples is the total of all displayed samples plus the other
states. If any ranges are overlapped and samples fall in multiple
buckets, these samples are only counted once in total samples.