
User`s guide

375
System Performance Analysis (SPA) Software
System Performance Analysis Software
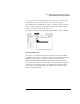
The default high and low values represent the full range of the label
you chose. Before changing these values, you may want to run the
acquisition and acquire some data to view activity over the entire range
of the label. You can then zoom in on areas of interest.
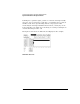
You can enter low and high values in binary, octal, decimal,
hexadecimal, ASCII, or symbol.
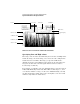
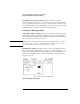
Interpreting the histogram display
Press the blue shift key and Run to start the State Overview
acquisition. As the data is sampled and sorted, the buckets along the X
axis will accumulate. The relative size of the vertical bars show the
distribution of activity on the label you chose. The analyzer will
continue to sample, sort the data, and update the display until you
press Stop or until you change a display variable.
Max count represents the current upper limit of the Y axis for the
bucket with the greatest number of data samples. Max count for the
limit of the Y axis will increase as the buckets fill with samples.
Read Total count to find the total number of samples taken over the
specified range of the label. This is not affected by the low and high
values.
Using the markers. To find the number of data samples in any
bucket, select the Xmarker or Omarker field. Turn the knob to move
the marker to the area of interest. Read the X Mark count or O Mark
count values to determine the number of samples in the current
bucket.
As you move either marker across the display, the value in the XMarker
or OMarker pop-up will change. The amount of change of the marker's
value represents the size of the bucket.