
User`s guide


381
System Performance Analysis (SPA) Software
System Performance Analysis Software
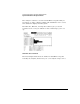
Using Auto-range. To quickly set up all 8 time interval ranges, select
the Auto-range field. Enter the minimum time and maximum time for
all 8 ranges combined. Then, when you select Log Scale or Linear
Scale, all 8 ranges will be scaled accordingly between the Minimum and
Maximum times. See the figure on the previous page for the Auto-
range pop-up. Common boundaries of adjacent ranges are not
considered overlapped. Values that fall on the common boundary will
be included in the highest range.
A fast way to set up the Time Interval display is to define your Start and
End events and select Run using the default ranges. Select Repetitive
Run mode. After accumulating data for a while, press Stop. Then select
Auto-range and enter the Min time and Max time display statistics in
the Auto-range Minimum time and Maximum time fields. When you
select Log Scale or Linear Scale, the ranges will be defined
automatically.
Interpreting the histogram display. As the analyzer samples the
data, it searches for Start/End event pairs. One event pair is considered
one sample. The time value for each event pair is compared to each
defined time interval range. The range's count is incremented if the
time value falls within that range.