
User`s guide

57
Using the Logic Analyzer
Using the Analyzer Menus
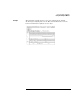
To examine an analyzer waveform
The Analyzer Waveform menu lets you view state or timing data in a
format similar to an oscilloscope display. The horizontal axis represents
states (in state mode) or time (in timing mode) and the vertical axis
represents logic highs and lows.
1 In Analyzer mode, press the Run key to acquire data.
In any mode other than Analyzer, Scope, or Patt Gen, pressing the Run
key has no effect. The menus which ignore Run, lack the Run field
onscreen. In Analyzer mode with Run available, the menu changes to a
display menu.
2 Go to the Analyzer Waveform menu.
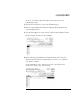
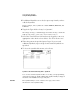
3 To adjust the horizontal axis (sec/Div or states/Div), use the
knob.
If nothing happens when you turn the knob, make sure the Div field has
a roll indicator above it, as in the figures on the next page. When you
first enter the Waveform menu, the knob adjusts the horizontal axis but
if you select another rollable field, the knob will control that field
instead.
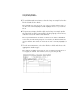
4 To adjust the display relative to the trigger, select the Delay field
and enter a value or use the knob.
The portion of memory being displayed is indicated by a white bar
along the bottom of the display area. The position of the trigger in
memory is indicated by a red dot on the same line. When the bar
includes the dot, then the trigger is visible on the display as indicated
by a vertical line with a "t" underneath.