
User`s guide


Contents ▲ 155 ▼ Index
Example: Result Flagging
Sample 1 contains 100 ng/µl proteins. The electropherogram shows 2 peaks for 2
different proteins, which could be separated. One peak can be found at 32 kDa (LDH).
Sample 2 contains 60 ng/µl proteins and shows 3 peaks.
Sample 3 contains 80 ng/µl proteins and shows 5 peaks.
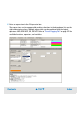
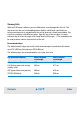
Now, the following rules are defined (the syntax is explained in “Result Flagging Tab” on
page 474):
1. Is there a peak at 30 kDa +/- 7%?
Rule 1:
PeakFound(30, PER, 7)
2. Is the total concentration of proteins higher than 90 ng/µl?
Rule 2:
TotalConcentration() > 90
3. Were 5 to 10 peaks found?
Rule 3:
NumberOfPeaks() >= 5 AND NumberOfPeaks <= 10
Alternative Rule 3:
NumberOfPeaks() BETWEEN (5,10)
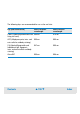
Applying these rules in the given order (in Normal mode) leads to the following results:
For sample 1, rule 1 matches and defines the color. Rule 2 would also match, but is not
checked, because the procedure stops at the first match.
For sample 2, none of the rules match, if there is no peak at 30 kDa +/- 7%. Therefore,
this sample will get the default color.
For sample 3, only rule 3 matches and defines the color.