
User`s guide

Contents ▲ 183 ▼ Index
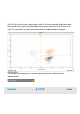
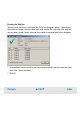
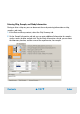
The Dot Plot sub-tab shows single events (cells) as they are detected, displayed as dots.
In the coordinate system, the red and blue fluorescence intensity of each event can be
read. The name of the currently measured sample is displayed above the graph.
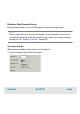
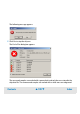
The number of the sample that is currently being measured is indicated on the
information bar: