
User`s guide

Contents ▲ 203 ▼ Index
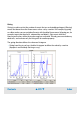
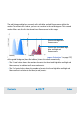
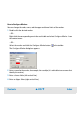
The following figures illustrate gating from blue to red.
The two histograms display all measured events in the blue histogram and in the red
histogram without gating. In this case, you cannot see which cells fluoresce only in the
blue and which fluoresce only in the red.
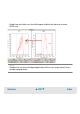
All events that show
red fluorescence
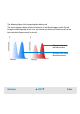
All events that show
blue fluorescence