
User`s guide

Contents ▲ 348 ▼ Index
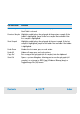
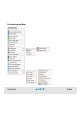
Graph Mode Lets you select one of the following click-and-drag operations on
electropherograms:
• Zoom
Magnifies the corresponding region to the full display.
• Pan
Moves the graph, makes especially sense for already zoomed
graphs.
• Scale
Dragging left or down shrinks the display in that direction,
dragging right or up magnifies the display in that direction.
Link Graphs If this option is enabled, then all zoom, pan and scale steps are
effective in all electropherograms.
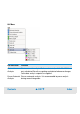
Show Data Points Shows/hides the data points used to generate the
electropherogram. Data points are visible only in the single-well
view. Data points are 0.05 seconds apart as the time resolution of
the data points is 0.05 seconds, which corresponds to their data
acquisition rate (of 20 Hz).
Show Gradient Puts a gray-to-white gradient on the background of the
electropherogram(s), or removes the gradient.
Show Grid Shows/hides grid lines (single-well view only).
Electropherogram
menu item
Function