
User`s guide


Contents ▲ 357 ▼ Index
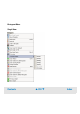
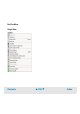
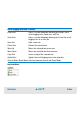
Dot Plot menu item Function
Single View Displays the current dot plot in single view.
Grid View Switches to the grid view and highlights the current dot plot.
Undo Zoom Undoes the last zoom action.
Undo All Undoes all zoom actions.
Gradient Puts a gray-to-white gradient on the background of the selected dot
plot, or removes the gradient.
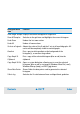
Copy Graph To
Clipboard
Puts a copy of the selected dot plot into the clipboard.
Copy Graph To File Opens a system dialog box, allowing you to save the selected dot
plot as an image in Windows Meta File (.wmf), Windows Bitmap
(.bmp), or JPEG (.jpg) format.
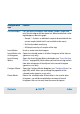
Insert Region Enters the region drawing mode, allowing you to draw a new region
in the dot plot. The mouse cursor changes its shape to a crosshair.
Delete Region Deletes the selected region. If the region is also used in other dot
plots, you will be asked whether to remove it from all dot plots that
use it or only from the selected dot plot.
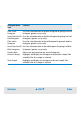
Configure Region Opens the Configure Region dialog box (see “Configure Region” on
page 547), which allows you to change the properties of the
selected region (generic assays only).