
User`s guide

Contents ▲ 372 ▼ Index
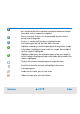
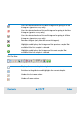
Starts automatic analysis. Peaks are detected, and the Peak Table
gets calculated. Results are getting recalculated whenever changes
to the data analysis setpoints are applied.
Pauses automatic analysis. It is recommended to pause analysis
during manual integration.
Analysis is switched off. Raw data is displayed on the
Electropherogram tab and the Peak Table is cleared.
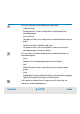
Highlights and displays the electropherogram of the previous sample.
If the ladder is highlighted, jumps to the last sample. Not available if
the first sample is highlighted.
Highlights and displays the electropherogram of the next sample. If
the last sample is highlighted, jumps to the ladder. Not available if the
ladder is highlighted.
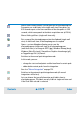
Displays the current electropherogram in single-well view.
Switches to the multi-well view and highlights the current
electropherogram.
Undoes the last zoom, pan, or scale action.
Undoes all zoom, pan, and scale actions.