
User`s guide


Contents ▲ 443 ▼ Index
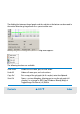
The analyzed data depends on the assay type:
• DNA
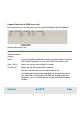
Default table columns are:
Peak Number
(leftmost column)
The order in which the peaks were detected.
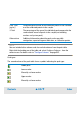
Second column Symbols in this column indicate the peak type.
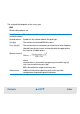
Size [bp] The number of calculated DNA base pairs.
Conc. [ng/µL] The concentration in nanograms per microliter for each fragment
(derived from the area/conc. relationship with the upper marker,
the same for all ladder peaks).
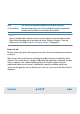
Molarity (nmol/l)
where:
concentration is measured in nanograms per microliter (ng/µl)
size is measured in base pairs (bp),
660 is the molecular weight of one base pair.
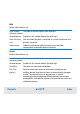
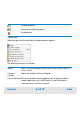
Observations Additional information about the peak such as possible
comigration or expected fragment indication.
Molarity
Concentration 10
6
×
660 Size×
---------------------------------------------------------------------------
=