
User`s guide


Contents ▲ 448 ▼ Index
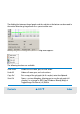
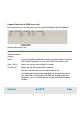
Fragment Table sub-tab (RNA assays only)
For each peak (rows), the table shows results for the predefined/specific fragments.
Default table columns are:
Fragment
Number (leftmost
column)
The order in which the fragments were detected.
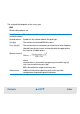
Name A user-assigned or predefined name for the found fragment. Typically
16S/23S for Prokaryote assays or 18S/28S for Eukaryote assays.
Start Time [s] Shows the start time for the peak in seconds.
End Time [s] Shows the end time for the peak in seconds.
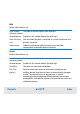
The start and end times are also represented on the
electropherogram by diamond-shaped dots on the peak baseline in
the same color as that shown in the RNA tab. Dragging a dot will
change the start or end time and alter the baseline drawn between
the dots.