
User`s guide


Contents ▲ 462 ▼ Index
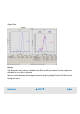
Histogram View
Histograms are graphical representations of the measurement results, where the number
of events is mapped to the Y axis and their fluorescence values to the X axis. The X axis
can be logarithmic or linear. The resulting curves show the frequency distribution of the
events in relation to their fluorescence intensity values.
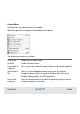
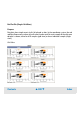
In the Grid View, an overview of all samples is shown. The small histograms are labeled
with the sample name, and below them, the total number of events and the %-value of
the covered events can be read. You can select a single histogram by clicking on it or you
can move the focus with the arrow keys.
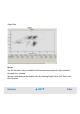
Double-clicking a blue or red histogram in the Grid View takes you to the Single View,
displaying a larger view of the histograms and a result table below each histogram. The
histograms can be evaluated statistically using markers. Markers define ranges of
fluorescence intensity values. Using a marker, one histogram defines a subset of events
(cells). You can set markers for both histograms. Only the marker in the left histogram
defines a range for the right one, but both define subsets for the statistical information.
Only events with a fluorescence value within this range are displayed in the other
histogram. This method is called gating. For Apoptosis and Antibody Staining, the blue
histogram is used for gating, while GFP assays use the red histogram. If you use a
Generic assay, you can define the markers and the direction to be used for gating. You
can adjust marker positions using the mouse and define its name and color (see “How to
Move the Upper and Lower Limits of Markers” on page 211 and “How to Configure
Markers” on page 209).