
User`s guide


Contents ▲ 463 ▼ Index
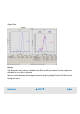
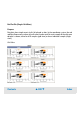
Result Tables
The result tables show a number of calculated values (columns) for each histogram. If
you add or redefine markers, the data in the result tables is recalculated.
If the option Hide superset curve... is disabled in the setpoint explorer (see “Assay
Properties Tab” on page 418), two additional rows are displayed in the gated histogram’s
result table—”CD3-APC on all events” and “CD3-APC on subset” in the example above.
The superset curve shows a histogram of all measured events; the gate is not
considered.
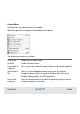
Default table columns are:
Marker Marker used for gating or as subset. When using an Apoptosis assay,
Calcein is used for gating and Annexin as a subset, for example.
Min Minimum fluorescence value of the corresponding marker.
Max Maximum fluorescence value of the corresponding marker.
#Events Number of events. For the histogram you use for gating, the number
of all events is displayed.
% Total Percentage of events. The marker used for gating has 100%, while
the table of the gated histogram shows the value of the subset.