
User`s guide


Contents ▲ 468 ▼ Index
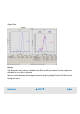
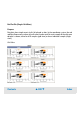
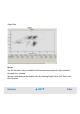
Dot Plot Tab (Single/Grid View)
Purpose
Dot plots show single events (cells), displayed as dots. In the coordinate system, the red
and blue fluorescence values of each event can be read. For each sample of the chip, one
dot plot is shown, either for all 6 samples (grid view) or for an individual sample (single
view).
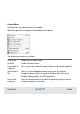
Grid View