Contents ▲ 507 ▼ Index
Elements
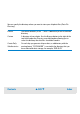
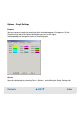
Signal Color The colored box next to Signal n (where n stands for the sample
number) shows the color of the curve in the overlaid graph. Click this
box to open the Color dialog box. You can select a color and assign it
by clicking OK.