
User`s guide

Contents ▲ 95 ▼ Index
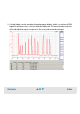
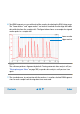
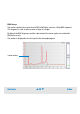
6. Two DNA fragments are run with each of the samples, bracketing the DNA sizing range.
The “lower marker” and “upper marker” are internal standards used to align the ladder
data with data from the sample wells. The figure below shows an example of assigned
marker peaks in a sample well.
NOTE
The software performs alignment by default. Turning automatic data analysis off (see
“Electropherogram Menu” on page 345) suspends data analysis until you turn it on
again.
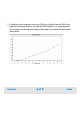
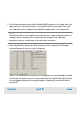
7. The standard curve, in conjunction with the markers, is used to calculate DNA fragment
sizes for each sample from the migration times measured.
Lower marker
Upper marker