Agilent PN E5500-1 Pulsed Carrier Phase Noise Measurements Using Agilent E5500 Series Solutions Product Note
Table of Contents 3 1. Introduction 4 2. Making residual (two-port) measurements on pulsed carriers Residual measurement considerations Hardware configuration Step-by-step procedure Example 1: Residual noise floor using an Agilent 83732B as the source (non-pulsed carrier) Example 2: Pulsed carrier noise floor using an Agilent 83732B as the stimulus source Example 3: Residual measurement of an Agilent 8347A amplifier 22 3.
1. Introduction The sensitivity and usefulness of many wireless RF and microwave systems is limited by the phase noise characteristics of their system. In pulsed radar systems, for example, the phase noise of the receiver local oscillator sets the minimum signal level that must be returned from a target for it to be detected. In this case, phase noise affects the selectivity of the radar receiver, which in turn determines the effective range of the overall system.
2. Making residual (two-port) measurements on pulsed carriers This chapter presents the recommended procedures and hardware configurations for making residual or two-port phase noise measurements on pulsed carriers. Residual measurement considerations Phase detector selection For carrier frequencies greater than the standard input frequency range, another phase detector must be used.
Source AM noise suppression For absolute phase noise measurements, AM noise contributions to the baseband signal (after the phase detector) are typically well below the phase noise contributions and therefore are usually ignored. For a residual phase noise measurement, however, the contribution to the baseband signal from AM noise can often exceed the contribution of the system phase noise contribution (measurement system phase noise floor).
The operator can place the LNA in a “fixed” gain configuration and select the amount of gain to use (14 dB to 56 dB of gain in 14-dB steps), or the operator can select “pause after auto LNA gain” and manually adjust the LNA gain before the measurement is started. It is also acceptable to manually select an internal low-pass filter (LPF) to help reduce the phase transients—being coincident with the pulse, they will appear as PRF feedthrough (which usually necessitates the use of a PRF filter).
Minimum duty cycle The duty cycle of the pulsed carrier has a direct impact on the system noise floor. This is seen as a scaled degradation of the noise floor by 20 log (duty cycle) in a residual measurement, due to a scaling of detector constant by the duty cycle. While the recommended minimum duty cycle of 1 percent was selected to provide a usable noise floor, it is possible to reduce the duty cycle even further, providing the system noise floor remains low enough to be useful for the measurement.
As shown with Figures 2-5 and 2-6, the recommended calibration method is “Derive From SingleSided Band Spur” to measure the phase detector constant automatically (this technique is described in the Agilent E5500 series user documentation). The double-sided spur technique may also be used. The spur frequency must be kept below PRF/4. These techniques allow the phase detector constant to be measured with the DUT configured into the measurement.
Step-by-step procedure The following step-by-step procedure can be used when making pulsed residual measurements with any Agilent E5500 series phase noise measurement solution. Modifications will be required for different carrier frequencies, duty cycles, PRF, source types, and so forth. Three measurement examples using the same basic procedure are given: 1) a noise floor measurement for a non-pulsed carrier signal; 2) a noise floor measurement for a pulsed carrier signal; and 3) a DUT measurement.
5. Set up the phase noise measurement system. a) From the Define menu, choose Measurement; then define the measurement per the parameter data provided in Table 2-3. When all of the forms have been defined, choose the Close button. 6. Select View Meter (Tool Bar Icon). a) This internal meter provides quadrature status; the black bar is not present when quadrature is set. 7. Start New Measurement. a) Select New Measurement from the Measure pulldown menu.
b) When the connect diagram is displayed, check hardware and connections. 1) Connect scope to monitor port of 70420A test set. 2) Set scope to monitor waveform. 3) Connect the signal paths to the phase noise test set. 4) Set quadrature (set the signal to zero volts on scope and a null on View Meter). c) Select Continue. d) When prompted by the software, connect the calibration signal from the calibration source to the coupler, then select Continue.
Table 2-3. Parameter Data for CW Residual Noise Floor Measurement Step Parameters Data 1 Type and Range Tab Measurement Type Couple Graph Type Start Offset Frequency Stop Offset Frequency FFT Minimum Number of Averages FFT Quality Swept Quality Residual Phase Noise (without using a phase-lock loop) Checked 10 Hz 100 E+6 Hz 4 Normal Fast Sources Tab Carrier Source Frequency Power Detector Input 1.5E+9 Hz 10 1.
Example 2: Pulsed carrier noise floor using an Agilent 83732B as the stimulus source 1. Connect the components as shown in Figure 2-9. The amplifier after the pulse modulator may be necessary to set the appropriate power levels at the signal and reference inputs of the phase noise measurement system. Do not connect the signal paths to the phase noise measurement system at this step. 4. Set up calibration source. a) Carrier frequency: 1.
5. Set up the phase noise measurement system. a) From the Define menu, choose Measurement; then define the measurement per the parameter data provided in Table 2-4. When all of the forms have been defined, choose the Close button. 6. Select View Meter (Tool Bar icon). a) This internal meter provides quadrature status; the black bar is not present when quadrature is set. 7. Start New Measurement. a) Select New Measurement from the Measure pulldown menu.
b) When the connect diagram is displayed, check hardware and connections. 1) Connect scope to monitor port of 70420A test set. 2) Set scope to monitor waveform. 3) Connect the signal paths to the phase noise test set. 4) Set quadrature (set the signal to zero volts on scope and a null on View Meter). c) Select Continue. d) When prompted by the software, connect the calibration signal from the calibration source to the coupler, then select Continue.
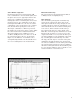
Figures 2-11 and 2-12 show pulsed residual phase noise measurements where the PRF is 20 kHz and the duty cycle is 10 percent, but different low-pass filters are used to demonstrate the effects of the PRF—even though measurement results are valid only out to PRF/2 in offset frequency. Figure 2-11 shows a broad offset range pulsed carrier measurement using only the default 100-MHz low-pass filter and allowing the system to autorange the LNA.
Table 2-4. Parameter Data for Pulsed Carrier Residual Noise Floor Measurement Step Parameters Data 1 Type and Range Tab Measurement Type Couple Graph Type Start Offset Frequency Stop Offset Frequency FFT Minimum Number of Averages FFT Quality Swept Quality Residual Phase Noise (without using a phase-lock loop) Checked 10 Hz 20 E+3 Hz 4 Normal Fast Sources Tab Carrier Source Frequency Power Detector Input 1.5E+9 Hz 10 1.
Example 3: Residual measurement of an Agilent 8347A amplifier In this configuration, the phase detector constant will be measured with the DUT configured into the measurement. If the power levels into the Agilent 70420A are the same as in Example 2, the phase detector constant will also be similar. 1. Connect the components as shown in Figure 2-13.
6. Set up the phase noise measurement system. a) From the Define menu, choose Measurement; then define the measurement per the parameter data provided in Table 2-5. When all of the forms have been defined, click the Close button. 7. Select View Meter (Tool Bar icon). a) This internal meter provides quadrature status; the black bar is not present when quadrature is set. 8. Start New Measurement. a) Select New Measurement from the Measure pulldown menu.
b) When the connect diagram is displayed, check hardware and connections. 1) Connect scope to monitor port of 70420A test set. 2) Set scope to monitor waveform. 3) Connect the signal paths to the phase noise test set. 4) Set quadrature (set the signal to zero volts on scope and a null on View Meter). c) Select Continue. d) When prompted by the software, connect the calibration signal from the calibration source to the coupler, then select Continue.
Table 2-5. Parameter Data for Pulsed Carrier Amplifier Residual Measurement Step Parameters 1 Type and Range Tab Measurement Type Couple Graph Type Start Offset Frequency Stop Offset Frequency FFT Minimum Number of Averages FFT Quality Swept Quality Residual Phase Noise (without using a phase-lock loop) Checked 10 Hz 200 E+3 Hz 4 Normal Fast Sources Tab Carrier Source Frequency Power Detector Input 1.5E+9 Hz 10 1.
3. Making absolute phase noise measurements on pulsed carriers This chapter presents the recommended procedures and hardware configurations for making absolute phase noise measurements on pulsed carriers. For a complete description of how pulsing the carrier affects phase noise measurements, refer to Agilent Application Note 1309 Pulsed Carrier Phase Noise Measurements (literature number 5968-2081E).
Minimum duty cycle The duty cycle of the pulsed carrier has a direct impact on the system noise floor. This is seen as a scaled degradation of the noise floor by 20 log (duty cycle) in a residual measurement. The recommended minimum duty cycle of 5 percent was selected to provide a usable PLL signal that is necessary to phase-lock the reference source see Table 3-2.
Example 1: Absolute pulsed measurement— Agilent 8663A versus 83732B 1. Connect the components as shown in Figure 3-1, with the exception of routing the pulse generator signal directly to the “External Pulse Input” port of the Agilent 83732B. The 83732B is internally pulse modulated instead of externally. Do not connect the signal paths to the phase noise measurement system at this step.
4. Set up 8663A reference source. Since the zero-beat process must be manually instigated, the reference source must be operated in a manual mode only: a) Carrier frequency: 1.5 GHz. b) Amplitude: Set source power level to attain +15 dBm at the reference input port. c) EFC input port (rear panel) connected to the Voltage Tune port of 70420A. 5. Set up the phase noise measurement system. a) From the Define menu, choose Measurement; then define the measurement per the parameter data provided in Table 3-3.
If the Out-of-Lock warning message appears, verify that the voltage within the RF pulse “ON” portion is zero volts (observed on the scope). If phase-lock has been achieved, select Continue; if phase-lock has not been achieved, select Re-try. Phase lock indications include a flat zero-volt trace (no presence of any beat note or search signal). 7. When the measurement is complete, print the results and save the measurement file. Figure 3-2.
Table 3-3.
3. Set up pulse generator. a) Duty Cycle = 10% b) PRF = 20 kHz c) Amplitude = TTL level Using a microwave downconverter For carrier frequencies in the microwave range, the Agilent 70421A, 70422A, and 70427A microwave downconverters are available to downconvert a pulsed carrier to the RF frequency range, making it much easier to perform pulsed absolute phase noise measurements. In this configuration, the microwave downconverter is used to establish a measurement PLL. 4. Set up 8644B reference source.
5. Set up the phase noise measurement system. a) From the Define menu, choose Measurement; then define the measurement per the parameter data provided in Table 3-4. When all of the forms have been defined, choose the Close button. b) For this configuration, the 10-MHz reference oscillator within the down converter will be tuned to achieve measurement phase-lock. The internal PLL loops of the downconverter restrict the acceptable closed-loop measurement bandwidth to <<126 Hz.
5) Zero-beat sources to reduce beat note to <5 percent of PTR (2 Hz). (This is often accomplished in a non-pulsed condition since it is very difficult to view the beat note within the RF pulse, as observed on the oscilloscope.) c) Select Continue. If the Out-of-Lock warning message appears, verify that the voltage within the RF pulse “ON” portion is zero volts (observed on the scope). If phase-lock has been achieved, select Continue; if phase-lock has not been achieved, select Re-try.
Table 3-4.
4. Making AM noise measurements on pulsed carriers This chapter includes the recommended hardware configurations and step-by-step measurement procedures for making AM noise measurements on pulsed carriers. Measurement considerations Using an external AM detector: 1) Choose a low-barrier Schottky diode detector, if possible, since these detectors will handle more power than a point-contact detector, while being just as sensitive. 2) Terminate the diode with an external AM detector filter (70429A k21).
Table 4-1. Selecting an Internal Low-Pass Filter for AM Noise Measurements PRF LNA Low-Pass Filter ≥40 kHz ≥400 kHz ≥4 MHz ≥40 MHz 20 kHz 200 kHz 2 MHz 20 MHz detector is selected. This internal DC block may also be used with an external AM detector, but the minimum offset frequency will be limited to 10 Hz. 1. Connect the components as shown in Figure 4-2. Do not connect the signal path to the phase noise measurement system at this step.
6. Start New Measurement. a) Select New Measurement from the Measure pulldown menu. b) At the connect diagram, check hardware and connect the signal path to the signal input of the phase noise test set. c) Select Continue. d) When prompted by the software, connect the calibration signal from the calibration source to the coupler, then select Continue. e) When prompted by the software, disconnect the calibration signal from the calibration source, then select Continue. 7.
Table 4-2. Parameter Data for Pulsed Carrier AM Noise Measurement with Option 001 Test Set Step Parameters Data 1 Type and Range Tab Measurement Type Couple Graph Type Start Offset Frequency Stop Offset Frequency FFT Minimum Number of Averages FFT Quality Swept Quality AM Noise Checked 10 Hz 20E+3 4 Normal Fast Sources Tab Carrier Source Frequency Carrier Source Power Detector Input Frequency 1.5E+9 Hz 12 1.
Agilent Technologies’ Test and Measurement Support, Services, and Assistance Agilent Technologies aims to maximize the value you receive, while minimizing your risk and problems. We strive to ensure that you get the test and measurement capabilities you paid for and obtain the support you need. Our extensive support resources and services can help you choose the right Agilent products for your applications and apply them successfully. Every instrument and system we sell has a global warranty.