
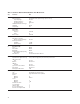
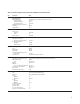
Specifications


15
b) When the connect diagram is displayed, check
hardware and connections.
1) Connect scope to monitor port of 70420A
test set.
2) Set scope to monitor waveform.
3) Connect the signal paths to the phase noise
test set.
4) Set quadrature (set the signal to zero volts
on scope and a null on View Meter).
c) Select Continue.
d) When prompted by the software, connect the
calibration signal from the calibration source
to the coupler, then select Continue.
e) When prompted by the software, disconnect
the calibration signal from the calibration
source, then select Continue.
8. When the measurement is complete, print the
results and save the measurement file.
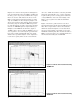
9. Interpret the results. Look for PRF feedthrough,
aliasing effects, and any breaks in the graph.
If PRF feedthrough is high and there are breaks
in the graph, set the LNA Gain to 56 dB of Gain.
Start a Repeat measurement and adjust the
quadrature at the connect diagram.
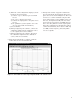
Note that the pulsed carrier noise floor is not
20 dB greater than the CW noise floor at all off-
set frequencies. This is due to the AM noise feed-
through of the stimulus source to the output of
the microwave phase detector. This AM noise
feedthrough is not affected by the pulsed carrier.
Figure 2-10. Pulsed carrier residual noise floor measurements
with 20 kHz LPF