
User`s guide

Scanner Maintenance and Calibration 8
Agilent 5500 SPM User’s Guide 149
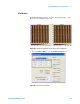
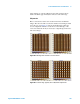
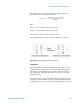
If the dimensions are not identical for the two features, adjust the Y
Non-linearity term according to the equation:
where
StartSize = size of features at the start of the scan
EndSize = size of features at the end of the scan
CurrentTerm = current non-linear correction term.
Use the diagram in Figure 102 as a guide for making the correction.
Figure 102 Correction diagram for Y Non-linearity
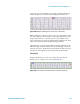
Y Hysteresis
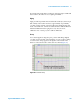
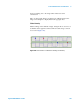
The next step will be to adjust the Y Hysteresis term. Assign one data
channel to display a single frame of the calibration target and place a
vertical cross-section through a line of features. Allow the scanner to
scan continuously, which will update the cross section plot each pass
through the frame.
Figure 103 shows the upward scan (blue marker) and downward re-trace
(red marker) data. The markers are used to measure the difference in the
acquired data at a given point on the Y axis. The blue marker was placed
NewTerm
StartSize CurrentTerm
EndSize
-----------------------------------------------------------------
=