
User`s guide

Closed-Loop Scanners 9
Agilent 5500 SPM User’s Guide 160
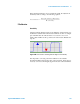
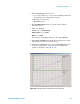
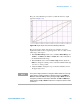
The goal of the calibration procedure is to make the Z Sensor output
appear as in Figure 110:
Figure 110 Target output of the Z sensor following calibration
The plot shows the output of the Z sensor as a function of Z piezo
displacement. The Z sensor output ranges from -10 V to +10 V over the
entire range of the Z piezo.
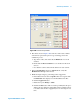
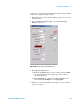
5 In the Realtime Images window choose Tools > Enter Range. Set
Y Min to -10.0000 and Y Max to 10.0000. The values will adjust to
the maximum allowable range.
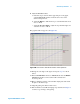
6 In the Z Sensor section of the Scanner Setup window adjust the
Offset to change the vertical position of the lines until their left edge
is as close to -10 as possible.
7 Adjust the Gain to change the slope of the lines until they meet in
the upper right corner.
NOTE
The Z piezo is highly sensitive to changes in Offset and Gain. To change
these values in smaller increments, click the mouse into the Offset or
Gain box. Hold down Ctrl key while pressing the Up or Down arrows to
change the parameter in 0.01 steps. Hold down the Ctrl and Shift keys
while pressing the Up or Down arrow keys to change the values in 0.001
increments.