
Technical data

Chapter 7 187
CDMA Analyzer
Using the CDMA Analyzer
CDMA Analyzer
green dot appears in place of the triangle. If the GPS is unavailable, a red X appears.
If this happens, you must choose another reference.
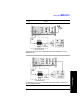
Interpreting the Display
The CDMA Tx Analyzer screen is divided into two sections:
• The trace display - that is, the graphic bar chart taking up most of the screen
• The metrics display - that is, a table of values at the bottom of the screen
The trace display contains a code domain power display. In this display 128 Walsh
codes are shown in bit-reversed order to represent the combined code channels for
the varying data rate traffic channels. The Y-axis labels display the relative power
(dB) or absolute power (dBm), threshold level, and dB/division. The X-axis labels
display active channel numbers. Active channel Walsh code numbers shown on the
display include:
• Pilot (red)
• Page (green)
• Sync (blue)
• Quick page (light blue)
• IS-95 traffic (yellow)
• cdma2000 traffic (orange)
• Unknown traffic (tan)
• Noise (light gray)
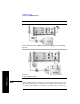
The metrics display shows 12 measurement parameters displayed below the trace
display in three columns and four rows—each with a value and units. For more
information about the parameters in the metric display, refer to “Metrics Provided
by the CDMA Tx Analyzer Measurement” on page 212.
The frequency indicator is at the bottom right, the time reference indicator at the
bottom left. For each indicator the text indicates which reference you have chosen.
A green LED indicates a locked condition, a red “X,” an unlocked condition.
Codogram Display
This view provides a history of the code power. The codogram plot rises over time
until it fills the graphical section of the display. Your most recent data appears at the
bottom of the display, and your oldest data (several minutes ago to several hours