
Technical data

226 Chapter 8
CDMA Over Air
Using the CDMA Over Air Tool
CDMA Over Air
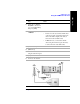
Codogram Display
This view provides a history of the spectrum. The codogram plot rises over time
until it fills the graphical section of the display. Your most recent data appears at the
bottom of the display, and your oldest data (several minutes ago to several hours
ago, depending on your settings) appears at the top of the display. In this way, you
can clearly see the changes in power that occur over a period of time. You can use it
to:
• see traffic channels as they initiate and terminate,
• track traffic channel call levels over time.
The
Update Interval is the interval, measured in whole seconds, between successive
records displayed on the codogram. In other words, if you set the update interval to
5 seconds, the codogram display will not update until after the first complete
measurement following a gap of five seconds. Alternatively, you can set the update
interval to provide the maximum data collection speed by pressing [Max Speed], or
by setting the update interval to 0 (zero) seconds.
NOTE It is not always possible for the analyzer to match the update interval you specify. It
is possible, for example, to set your update interval to zero seconds (the maximum
speed), and then to find that the analyzer can not update any faster than once every
two seconds.
Performing a Codogram Measurement
Step Notes
1[Display]
2 [Codogram] This displays the menu that controls the
appearance and behavior of the
codogram display.