
Technical data

Chapter 8 229
CDMA Over Air
Using the CDMA Over Air Tool
CDMA Over Air
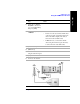
Interpreting the Display
The CDMA Over Air screen is divided into three sections: the code domain trace
display, strongest pilot trace display, and metrics display.
The code domain trace display contains 128 Walsh codes, which are shown in a
bit-reversed order to represent the combined code channels for the varying data rate
traffic channels. The Y-axis labels display the relative power (dB) or absolute power
(dBm), threshold level, and dB/division. The X-axis labels display active channel
Walsh Code numbers. Active code channels shown on the display include:
• Pilot (red)
• Page (green)
• Sync (blue)
• Quick page (light blue)
• IS-95 traffic (yellow)
• cdma2000 traffic (orange)
• Unknown traffic (tan)
• Noise (light gray)
The strongest pilot trace display contains the pilot dominance and multipath power
parameters. Awareness of these two parameter values helps you be sure that you are
making valid measurements on the sector of interest.
The metrics display shows 18 measurement parameters displayed below the trace
display in three columns and six rows—each with a value and units. For more
information about the metric display, refer to “Metrics Provided by CDMA Over Air
Measurements” on page 252.
The frequency indicator is at the bottom right corner of the screen, the time
reference indicator at the bottom left. For each indicator the text indicates which
reference you have chosen. A green LED indicates a locked condition. A red “X”
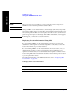
13 Enter the Delta Sync Pwr in
dB, using the numeric
keypad.
The delta sync power is the power level of the
the sync channel expressed as a dB value
relative to the pilot channel power level.
14 [dB]
Step Notes