
Technical data


Chapter 12 335
GSM and EDGE Analyzer
Using the GSM Analyzer and the EDGE Analyzer
GSM and EDGE Analyzer
Interpreting the Display
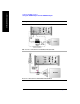
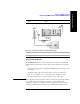
The GSM/EDGE Tx Analyzer screen is divided into two sections in the Channel
Scanner and the Spectrum views, and into three sections in the Power versus Time
view:
• The graphics display, that is, the graphic chart taking up most of the upper part
of the screen
• The metrics display, that is, the table of values at the bottom of the screen
• In the Power versus Time view only, the third section displayed is of slot
information. This is the row of power values at the top of the screen
NOTE The results metrics that are displayed will not correlate precisely with the plot that
you see. This is because the analyzer performs two or more separate data
acquisitions - at least one to gather the data for the graphical plot, and a separate
acquisition to display data for the metrics. Any small variances between the two
In service connection for an Over the Air Measurement
15 [Level/Location]
16 [Autoscale]
Step Notes