
Technical data


Chapter 12 337
GSM and EDGE Analyzer
Using the GSM Analyzer and the EDGE Analyzer
GSM and EDGE Analyzer
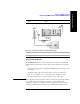
shown below. The entire channel’s Pass or Fail status is also displayed.
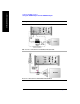
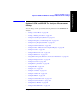
• Power vs. Time with Zoom set to “Rise/Fall”: The graphics display shows
power versus time for part of the selected slot ([Zoom Offset]) in the selected
channel ([Display], then [Position]). The power of the slot you selected is shown
against time.
The Y-axis labels display the absolute power (dBm), and dB/division. The
X-axis represents time. The portion of the X-axis to the left of the gray bar
represents from 60 μs before the start, to 60 μs after the start, of the slot of
interest.
The gray bar in the center of the display represents the central portion of the slot
for which no data is displayed.
The portion of the X-axis to the right of the gray bar represents from 60 μs
before the end, to 60 μs after the end, of the slot of interest. The power values
(“TS Pwr”) at the top of the screen represent the maximum TS Power for each of
the eight slots in the frame.
The slot whose trace is displayed is determined by your Zoom Offset setting. For
more details, see “Setting Zoom Offset” on page 352.
NOTE It is worth noting that regardless of which slot you have displayed in the graphics
portion of the screen, the displayed metrics always refer to the first slot, that is, to
Slot 0.
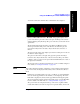
If the Power versus Time mask is set to On, you will also see a mask indicating
the lower and the upper limits for the channels you are displaying. The lower
limit mask is displayed in yellow, and the upper limit mask in magenta (pink).
The green signal trace must lie between these limits for it to pass the Mask Test.
For more details on the PvT mask, see “Setting PvT Mask” on page 354.
The power in each slot is displayed at the top of the screen, together with the
results of the mask test for each slot. A green ‘P’ represents a Pass, and a red ‘F’