
Technical data


338 Chapter 12
GSM and EDGE Analyzer
Using the GSM Analyzer and the EDGE Analyzer
GSM and EDGE Analyzer
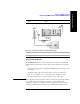
represents a Fail. The entire channel’s Pass or Fail status is also displayed.
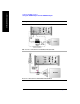
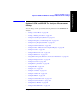
• Spectrum: The graphics display shows spectral power for the selected slot
([Slot Sync]) in the selected channel ([Display], then [Position]) measured in a
500 kHz acquisition bandwidth. The Y-axis labels display the absolute power
(dBm), and dB/division. The X-axis represents frequency, and shows the
frequency across the Channel selected with your [Position] setting.
The metrics display shows measurement parameters displayed below the trace
display in three columns and five rows—each with a value and units (the exceptions
are BSIC, TSC, and Mod Type, which have no units.) For more information about
the parameters in the metric display, refer to “Metrics Provided by the GSM and
EDGE Analyzer Measurement” on page 373.
The frequency reference indicator is at the bottom right, and the time reference
indicator at the bottom left. For each indicator the text indicates which reference you
have chosen. A green LED indicates a locked condition, a red “X,” an unlocked
condition.