
Technical data

Chapter 16 435
Spectrum Analyzer
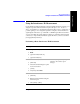
Spectrogram Display
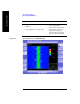
Spectrum Analyzer
Spectrogram Display
The Spectrogram view can be used with the Interference ID or the Occupied BW
measurements and standard spectrum. Troubleshooting a transmitter system is often
aided by examining the time evolution of the power distribution.
This view provides a history of the spectrum. You can use it to:
• locate intermittent signals.
• track signal levels over time.
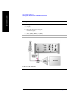
You may set the following parameters for this view:
• The
Update Interval is the interval, measured in whole seconds, between
successive records displayed on the spectrogram. In other words, if you set the
update interval to 5 seconds, the spectrogram display will not update until the
after the first complete measurement following a gap of five seconds.
Alternatively, you can set the update interval to provide the maximum data
collection speed by pressing [Max Speed], or by setting the update interval to 0
(zero) seconds.
NOTE It is not always possible for the analyzer to match the update interval you specify. It
is possible, for example, to set your update interval to zero seconds (the maximum
speed), and then to find that the analyzer can not update any faster than once every
two seconds.
A data sample is taken every n seconds for display on the spectrogram.
Increasing the update time allows data capturing over a longer period of time in
the spectrogram. However, it is a sampling technique that allows intermittent
events, which may occur between samplings, to be lost. Therefore, if you are
searching for intermittent signals, consider using Group Max average type in
conjunction with increasing the capture time (see “Setting Average, Sweep, and
Restart” on page 423).
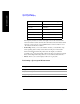
Approximate Times Taken to Display the Spectrogram
Update Interval Time for a Full Screen Display
Max. Speed 34 seconds
1 second 3 minutes