
Technical data

436 Chapter 16
Spectrum Analyzer
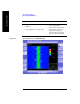
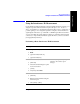
Spectrogram Display
Spectrum Analyzer
The frequency indicator is at the bottom right corner of the screen, the time
reference indicator at the bottom left. For each indicator the text indicates which
reference you have chosen. A green LED indicates a locked condition. A red
“X” indicates an unlocked condition.
• Frame Skip: Allows you to set the number of frames you would like to skip
when capturing data. You may set this value from skip 0 to 2147,483,647
frames. Increasing the frame skip value causes the display to redraw the
spectrum every n
th
trace and a block of lines is shown at once instead of a single
line at a time. Higher frame skip values are for use with fast measurements.
• Palette: Allows you to set the display to full color or grayscale.
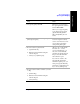
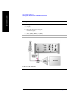
Performing a Spectrogram Measurement
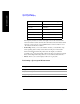
2 seconds 6 minutes
4 seconds 12 minutes
30 seconds 90 minutes (1.5 hours)
60 seconds (1 minute) 180 minutes (3.0 hours)
300 seconds (5 minutes) 900 minutes (15.0 hours)
600 seconds (10 minutes) 1800 minutes (30.0 hours)
Step Notes
1 [Spectrum Analyzer]
2 [Measurements]
3 [Spectrogram]
Update Interval Time for a Full Screen Display