
Technical data


442 Chapter 16
Spectrum Analyzer
Using the Interference ID Measurement
Spectrum Analyzer
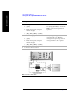
7 Set the level to Autoscale.
a. [Level]
b. [Autoscale]
8 Select the Interference ID
Measurement.
a. [Measurements]
b. [Interference ID]
c. On [Interference ID] select
On.
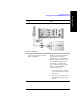
A marker will appear on the trace
at the left of the display. The
Frequency and power level at the
marker (Signal Pointer) is
displayed in the data window
below the trace display window.
The type of signal that is causing
the interference is also indicated.
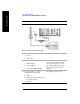
9 You can set marker to a signal peak by:
a. [Signal Pointer]
b. Enter the frequency using the
numeric keypad.
c. Select [GHz], [MHz], [kHz], or
[Hz].
OR by:
a. [Pointer to Peak]
b. Enter the frequency using the
numeric keypad.
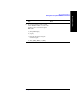
c. Select [Pointer To Next Peak] to
mark successively lower peaks.
The number displayed at the
bottom of the Pointer to Peak
button indicates the number of the
marked peak and the total number
of peaks. For example, 1/22
indicates the peak with the highest
power on the display and a total of
22 peaks displayed. 2/22 would
indicate the second highest peak,
3/22 the third highest, and so forth.
Pointer to Peak always returns the
marker to the highest peak.
Step Notes