
Technical data


444 Chapter 16
Spectrum Analyzer
Using the Occupied BW Measurement
Spectrum Analyzer
Using the Occupied BW Measurement
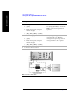
Occupied Bandwidth integrates the power of the displayed spectrum and puts
markers at the frequencies between which a selected percentage of the power is
contained. The measurement defaults to 99% of the occupied bandwidth power. The
power-bandwidth routine first computes the combined power of all signal responses
contained in the trace. For 99% occupied power bandwidth, markers are placed at
the frequencies on either side of 99% of the power. This would leave 1% of the
power evenly distributed outside the markers. The difference between the marker
frequencies is the 99% power bandwidth and is the value displayed.
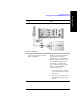
The Occupied BW result will correspond to the span between the two markers and
will be a multiple of the span between two points. So, for a 10 MHz span, the OBW
will come in multiples of 39.216 kHz (10 MHz divided by 255). Values will be 0,
39.216 kHz, 78.431 kHz, 117.647 kHz, and so forth. For narrow signals (TDMA,
PDC, and so forth) you will need to zoom in on the signal to get a reasonably
accurate Occupied BW result. For a 100 kHz span the Occupied BW resolution will
be 392 Hz (100 kHz divided by 255).
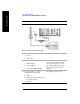
The occupied bandwidth measurement can be made in single or continuous sweep
mode. The center frequency and reference level may be set by you.