
Technical data

584 Chapter 20
W-CDMA or W-CDMA (with HSDPA) Over Air
Using the W-CDMA or W-CDMA (with HSDPA) Over the Air Tool
W-CDMA or W-CDMA (with HSDPA)
Over Air
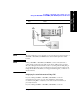
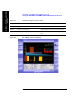
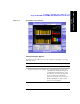
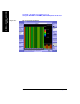
screens are divided into two sections in the Zoom view (default–Figure 20-1 on
page 586) and five sections in the Full view (Figure 20-2 on page 587) as follows:
•
Zoom view: The top-left graph (Code Domain Trace View) shows the power in
all 512 OVSF (Orthogonal Variable rate Spread Factor) Code Channels. Code
channels have variable width depending on the Spread Factor for the channel.
SF512 has 512 code channels with each channel 1 unit in width. SF256 has 256
channels with each channel 2 units in width. The width continues to double for
SF128, SF64, and so forth. The Y-axis labels display the relative power (dB) or
absolute power (dBm), threshold level, and dB/division. The X-axis labels
display active channel numbers.
The light blue section on the bottom bar corresponds with the section displayed
in zoom view (described below). The red line across the graph represents the
active channel threshold. The control channels are in the color indicated in
“Channel Descriptions and Acronyms”.
Active code channels shown on the display include:
• Red - Common Pilot Channel (CPICH)
• Yellow - Primary common control channel (P-CCPCH)
• Green - Secondary common control channel (S-CCPCH); if enabled under
the Setup menu
• Light blue - Paging Indication Channel (PICH) if enabled under the Setup
menu; also P-SCH
• Purple - S-SCH
• Orange - Active DPCH traffic channels
• Light yellow - Active HS-PDSCH (QPSK and 16QAM) traffic channels
• Noise (light gray)
•
Full view: The top-left graph (Code Domain Trace View) shows the power in the
first half of the OVSF channels (SF512 channels 0 - 255). The lower-left graph
shows the power in the other half of the channels (SF512 channels 256-511).
The code channel appearance and colors are the same as described above.
•
Zoom view: The lower-left graph (Zoom View) shows the power in the section
of the graph highlighted in light blue in the top-left graph, a section of 32, 64,
128, or 256 codes.
•
Zoom and Full views: The top-right graph (Strongest Pilot View) contains the
pilot dominance and multipath power parameters. This shows the strongest
Scrambling Codes seen by the test set. Active codes, that is, codes that reach or