
Technical data

588 Chapter 20
W-CDMA or W-CDMA (with HSDPA) Over Air
Using the W-CDMA or W-CDMA (with HSDPA) Over the Air Tool
W-CDMA or W-CDMA (with HSDPA)
Over Air
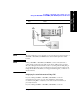
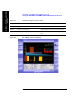
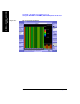
Codogram Display
This view provides a history of the code domain power. The codogram plot rises
over time until it fills the graphical section of the display. Your most recent data
appears at the bottom of the display, and your oldest data (several minutes ago to
several hours ago, depending on your settings) appears at the top of the display. In
this way, you can clearly see the changes in power that occur over a period of time.
You can use it to:
• see traffic channels as they initiate and terminate,
• track traffic channel call levels over time.
The W-CDMA or W-CDMA (with HSDPA) Over the Air Codogram screen is
divided into 3 sections in the Zoom view (default–Figure 20-3 on page 590) and 4
sections in the Full view (Figure 20-4 on page 591) as follows:
•
Zoom and Full views: The lower-right graph (Code Domain Trace view)
shows the power in all 512 OVSF (Orthogonal Variable rate Spread Factor)
Code Channels. For display details, refer to “Multiple-View Display” on
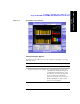
3 [Position] When you are in Zoom view, this option
changes the starting point (spread code)
of the section of the full view (upper
graph) that the Zoom view (lower graph)
will expand for more detailed analysis.
4 Enter the position using the
numeric keypad.
5[Enter]
6 On [Width] select [32], [64], [128]
or [256].
In Zoom view, smaller numbers selected
with this option correspond to narrower
zoom windows on the full view. If you
select 32 for example, you will have the
minimum window and maximum zoom.
You will also see channel information
displayed below each active channel.
This information is the spreading factor
used by that channel and its spread code
or OVSF number.
Step Notes